
From the founder
First off, thanks for reading our latest report on the state of ecommerce mobile apps. We put this together to help answer a question we hear all the time from brand operators: do mobile apps really make a difference?
The short answer? Yes. Especially now.
Customer acquisition is more expensive than ever. Retention channels like email and SMS are more crowded, and mobile web performance continues to decline.
That’s where mobile apps come in. They give your best customers a faster, more seamless way to shop, and they give you a direct, reliable line to reach them again and again. Apps are a retention engine. And when done right, they quietly drive some of the highest-margin, highest-LTV revenue in your entire business.
In this report, we’ve pulled together internal benchmarks, case studies, and industry data to show exactly how and why that’s happening, along with where we think things are headed next. I hope you find it useful.

Pietro Saccomani Founder of MobiLoud
Overview
Mobile apps can be a critical revenue driver for ecommerce businesses. On a user by user basis, apps consistently outperform other channels, and contribute significant value to the brand’s bottom line, and a clear ROI.
Increased online revenue Retail & ecom brands with mobile apps often see 10-30% of their total online revenue coming through their apps. High-performers’ apps contribute 50-60% of online revenue. These numbers come on a significantly lower share of their overall customer base.
Apps vs. mobile web Apps drive 3.5-7x higher average revenue per user compared to mobile web visitors, while delivering 1.7-3x higher conversion rates and 10-50% higher average order values.
Higher CLV The customer lifetime value of app users is 2.8-5x higher than web-only shoppers – and 60% of first-time app buyers stick around to make additional purchases.
Push notifications Abandoned cart push notifications alone are reason enough to build an app. A selection of MobiLoud users we studied generated $10,000-$200,000+ in additional monthly revenue from cart abandonment campaigns, paying off the cost of building their app multiple times over from a single automated push campaign.
Do apps really work?
This section takes a step back to answer the broader question we hear most often from brands:
We looked at five real MobiLoud customers across health, fashion, cosmetics, and cannabis to find out.
The data comes from their live apps in Q1 2025, with some supplemental examples from early Q2.
- Brand A: A wellness and pharmacy business
- Brand B: A luxury fashion label
- Brand C: A DTC cosmetics brand
- Brand D: A medical cannabis retailer
- Brand E: A second cosmetics brand
Let’s walk through the questions we hear most from teams thinking about whether an app is worth building.
How much revenue can an app actually generate?
Mobile apps often become a brand’s second highest revenue channel, with very minimal ongoing work. Especially true for brands with loyal users, high repeat purchases, or niche but engaged audiences.
Brand A Wellness
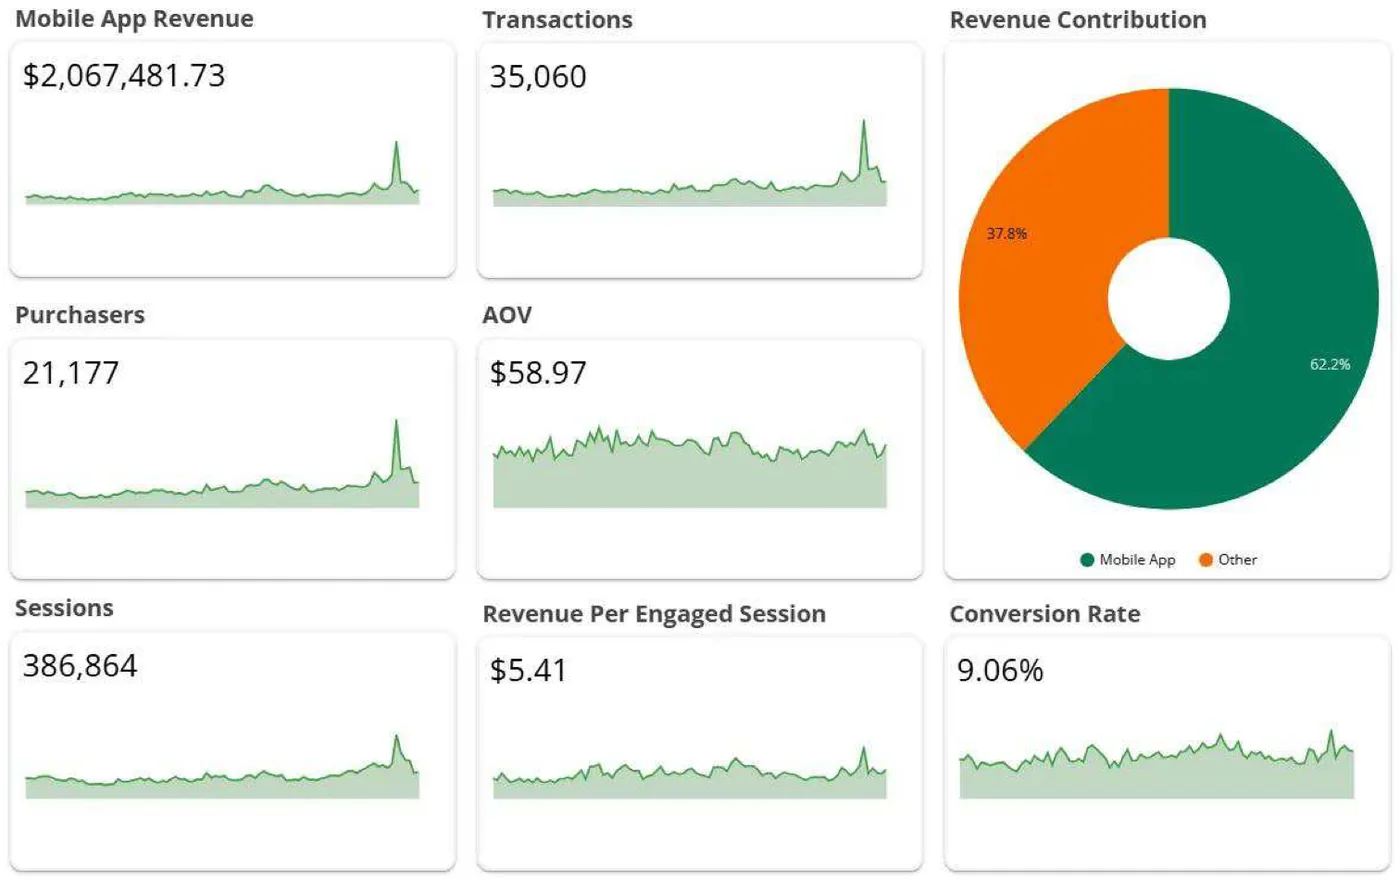
Brand A for example, a health and wellness retailer, had just under 16% of all customers using the app. That same group consistently generates more than 62% of total revenue.
Brand B Luxury fashion
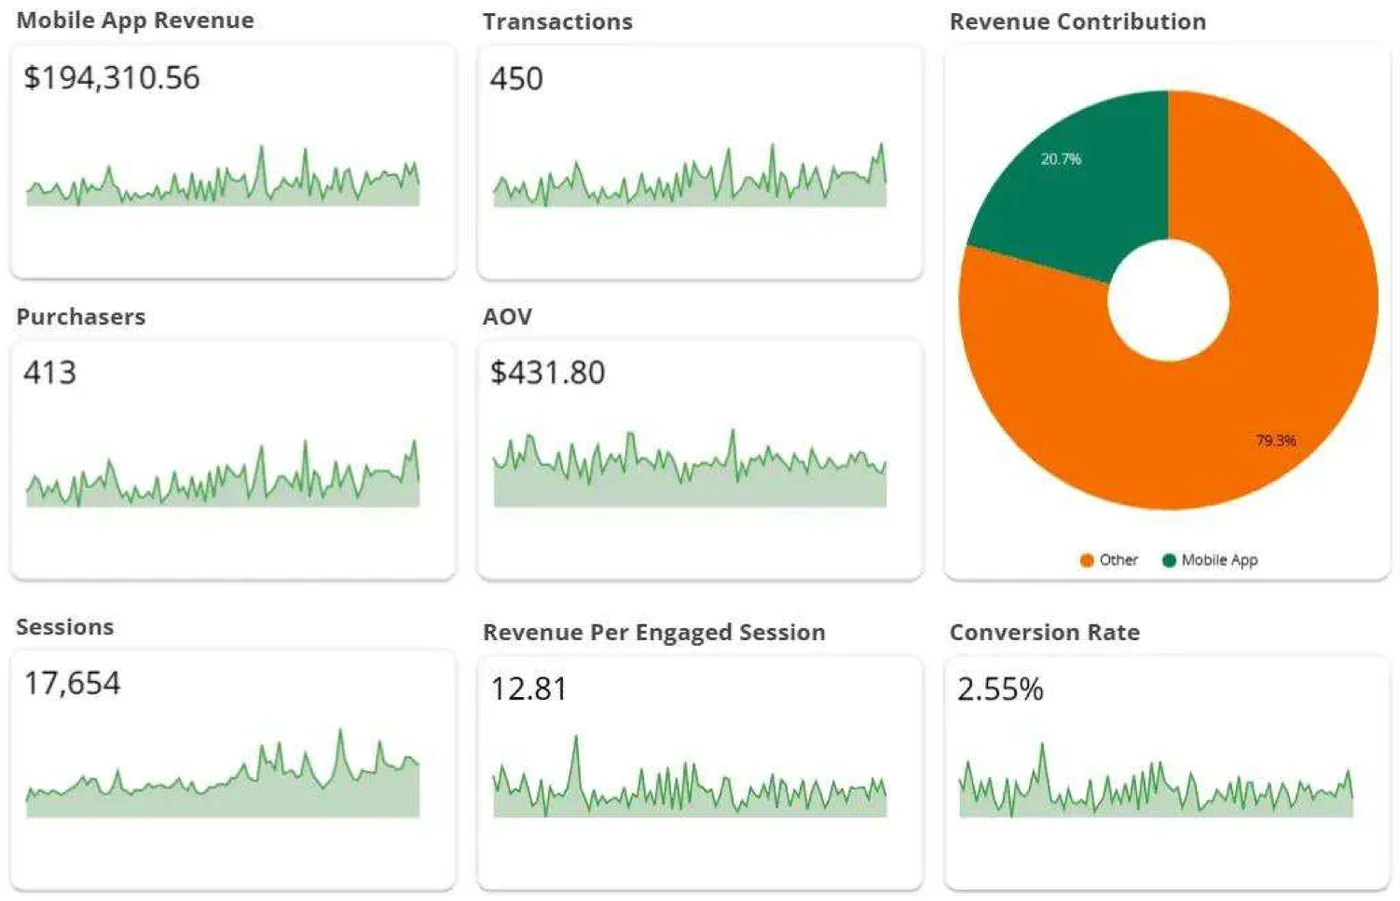
Brand B, a luxury fashion label, saw something similar. Only 7% of traffic came from app users, but they generated over 20% of all revenue.
Brand C Cosmetics
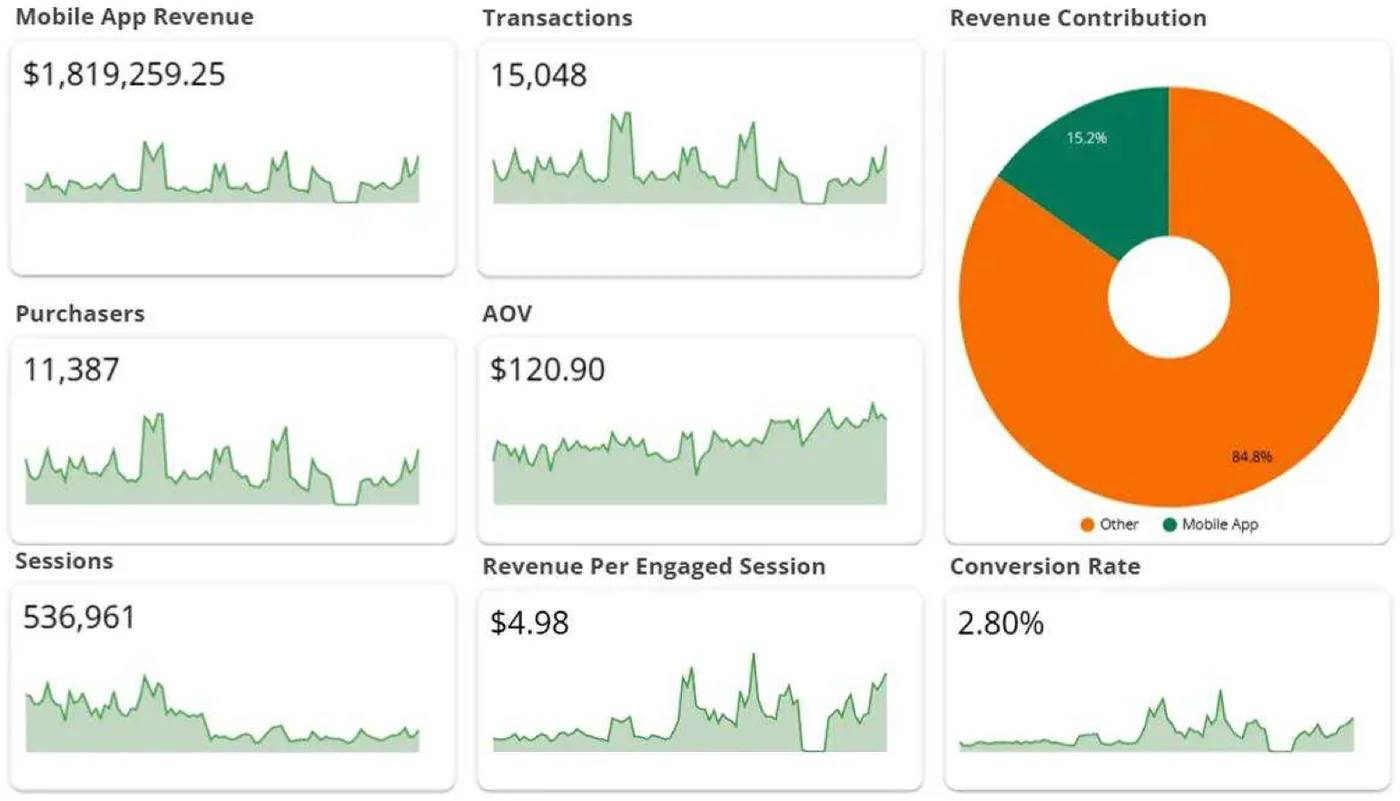
Brand C, a cosmetics company, saw 15% of all sales come through the app, even though app users accounted for just over 10% of all users.
| Brand | Share of users (app) | Share of revenue (app) | Revenue vs traffic |
|---|---|---|---|
| Brand A (wellness) | 15.8% | 62.2% | Nearly 4 times higher |
| Brand B (fashion) | 7.0% | 20.7% | 3 times higher |
| Brand C (cosmetics) | 10.5% | 15.2% | 1.5 times higher |
Even when the app serves a smaller audience, it consistently contributes a disproportionately large share of revenue. It becomes a place where your best customers naturally convert and spend more.
But I already have a mobile website. Why would I need an app?
Most brands have already invested in building a strong mobile web experience. And in many cases, it works well.
But what we see repeatedly is that giving your best customers a dedicated app experience drives dramatically better results from this cohort. Not by adding more traffic, but by unlocking stronger behavior from the customers most likely to convert.
Across wellness, fashion, and cosmetics, we saw consistent lifts in every metric that matters.
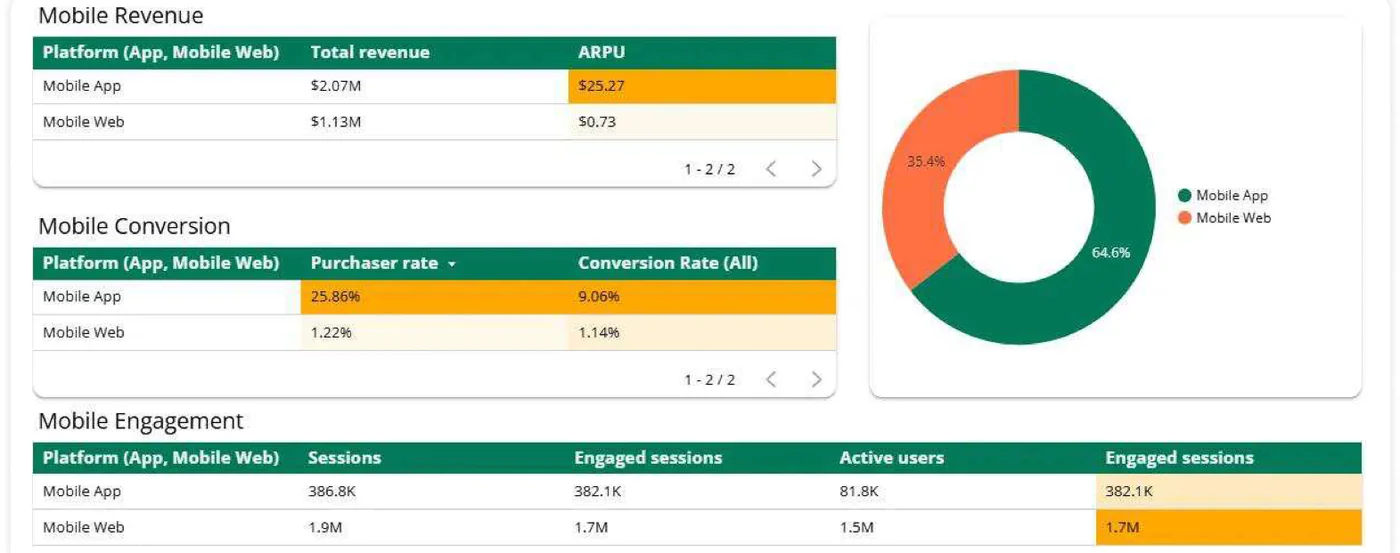
Brand A Wellness
| Metric | Mobile app | Mobile web | Lift |
|---|---|---|---|
| Average revenue per user | $25.27 | $0.73 | 34.6x |
| Average order value | $97.85 | $63.83 | 1.5x |
| Purchaser rate | 25.9% | 1.2% | 21.5x |
| Conversion rate | 9.1% | 1.1% | 8.0x |
| Engaged sessions per user | 4.7 | 1.1 | 4.3x |

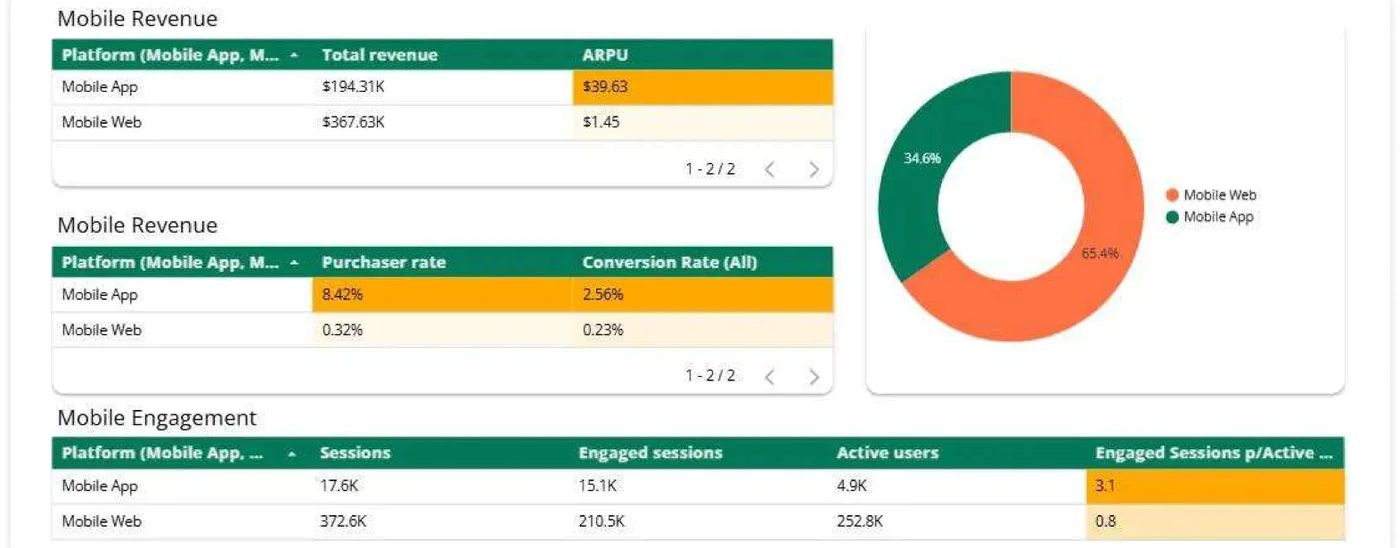
Brand B Luxury fashion
| Metric | Mobile app | Mobile web | Lift |
|---|---|---|---|
| Average revenue per user | $39.63 | $1.45 | 27.3x |
| Average order value | $103.57 | $59.17 | 1.75x |
| Purchaser rate | 8.4% | 0.3% | 26.3x |
| Conversion rate | 2.6% | 0.2% | 11.1x |
| Engaged sessions per user | 3.1 | 0.8 | 3.9x |

Brand C Cosmetics
| Metric | Mobile app | Mobile web | Lift |
|---|---|---|---|
| Average revenue per user | $10.43 | $3.23 | 3.2x |
| Average order value | $54.78 | $44.29 | 1.2x |
| Purchaser rate | 6.5% | 2.0% | 3.3x |
| Conversion rate | 2.8% | 1.5% | 1.9x |
| Engaged sessions per user | 2.1 | 1.2 | 1.75x |

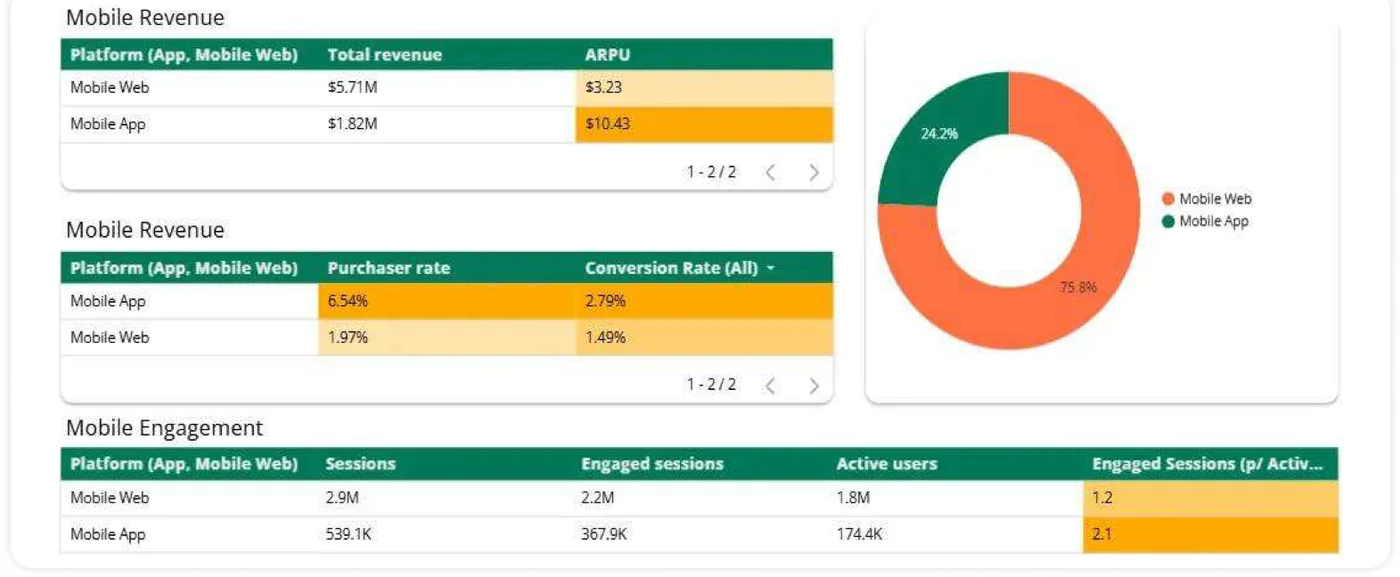
What about mobile traffic volume?
The apps also consistently outperformed mobile web despite having far fewer users.
| Brand | App users | Mobile web users | App share of mobile traffic | App share of mobile revenue |
|---|---|---|---|---|
| Brand A | 112,000 | 567,000 | 16% | 65% |
| Brand B | 4,900 | 252,000 | 2% | 35% |
| Brand C | 174,000 | 1.8 million | 9% | 24% |
The takeaway here is simple.
But when your best customers have access to a dedicated app, they behave differently. They spend more, convert more often, and come back more frequently.
Do apps help increase repeat visits and build habits?
Customers have their preferred way of engaging with a brand. Some prefer shopping on a website, others through social, and for your brand loyalists it’s a mobile app.
App users came back frequently and spent time exploring when they did.
Brand A Wellness
Their app users engaged with the brand 4x more on average and spent nearly 7 minutes on average per session.


Brand B Luxury fashion
They saw similar results, with their app users coming back 3x more and spending over 6 minutes on average every session.


Brand C Cosmetics
Brand C had slightly fewer repeat sessions, but longer browsing time per visit.


| Brand | Sessions per user | Average session time |
|---|---|---|
| Brand A (wellness) | 4.7 | 6 minutes 41 seconds |
| Brand B (fashion) | 3.1 | 6 minutes 28 seconds |
| Brand C (cosmetics) | 2.1 | 4 minutes 58 seconds |
The important thing to note is this isn’t passive traffic.
These are loyal, engaged customers who use the app like they use Instagram or TikTok. They open it frequently and stay long enough to browse or purchase.
Do app users convert better?
Yes. And the lift was significant across every brand.
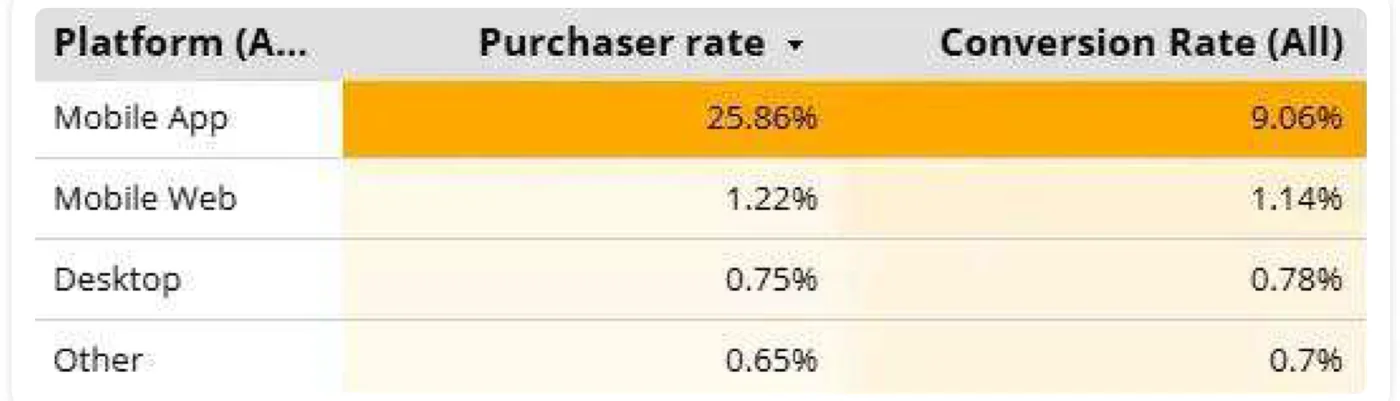
Brand A Wellness
Brand A’s average conversion rate is 9% in the app, compared to just over 1% on mobile web.

Brand B Luxury fashion
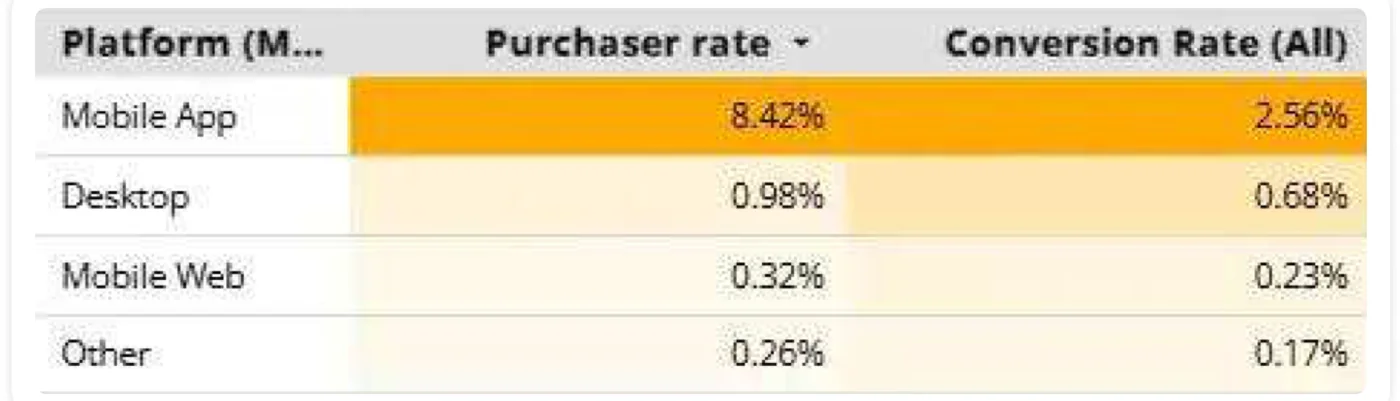
Brand B has a much lower baseline CVR due to it being luxury fashion, but still saw a 10x lift when comparing mobile app to mobile web.

Brand C Cosmetics
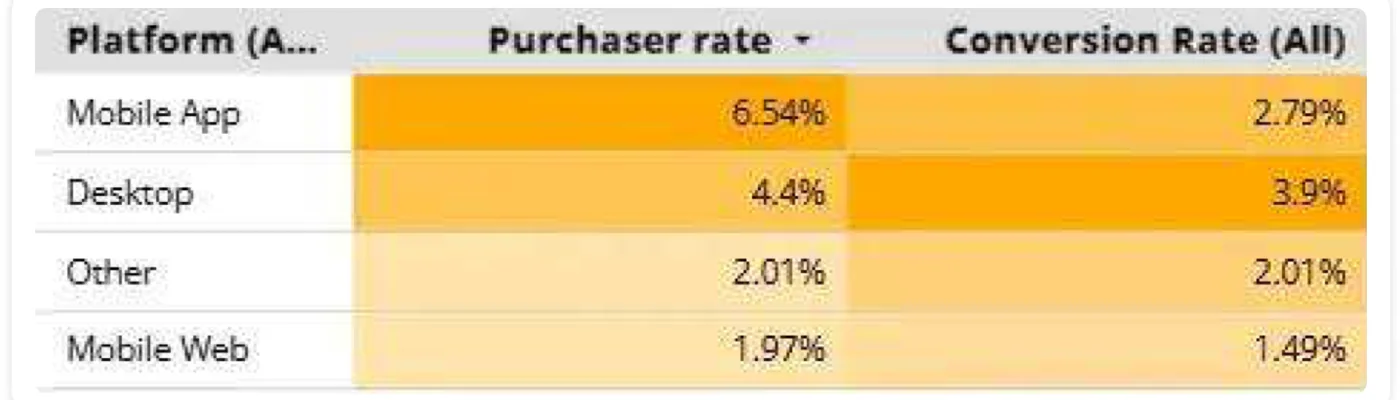
Brand C saw slightly stronger desktop performance, but the app converts 1.5x better than mobile web.

| Brand | Conversion rate (app) | Mobile web | Desktop |
|---|---|---|---|
| Brand A (wellness) | 9.06% | 1.14% | 0.78% |
| Brand B (fashion) | 2.56% | 0.23% | 0.53% |
| Brand C (cosmetics) | 2.79% | 1.49% | 3.90% |
Do push notifications actually work?
The short answer is yes.
The slightly longer answer is that they often outperform other retention channels while requiring far less effort to maintain.
Brand A Wellness
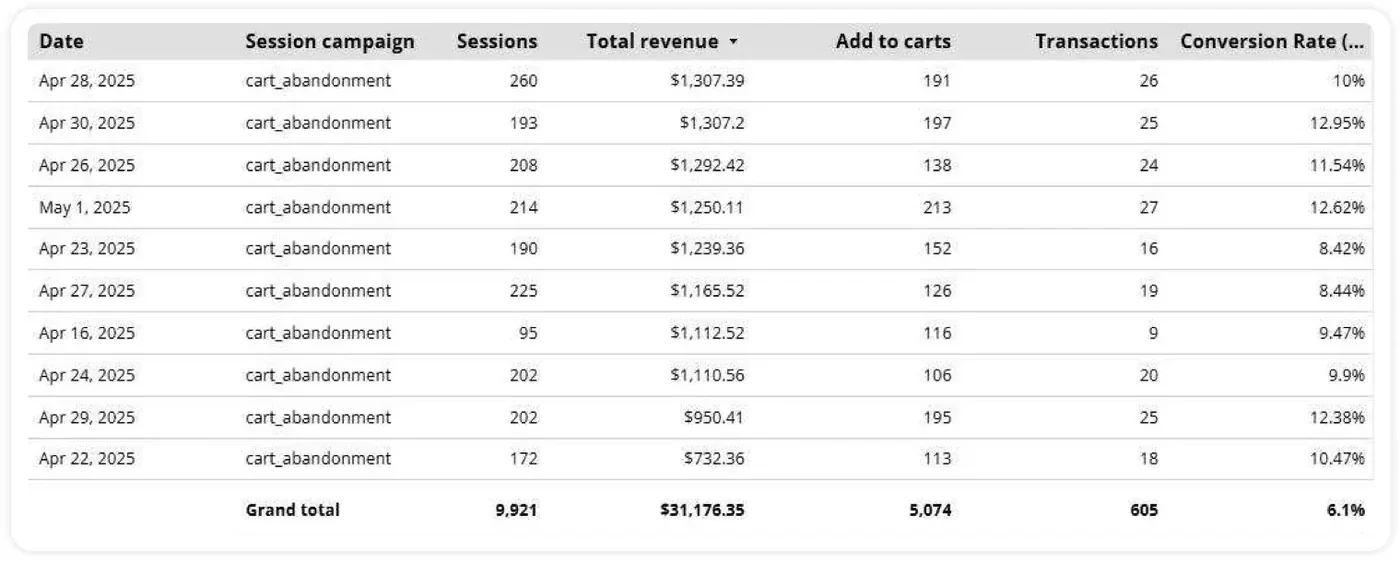
This brand turned on push for the first time near the end of Q1. In April alone, they generated over $31K from push, with nearly half of that coming from automated abandoned cart push.

Brand B Luxury fashion
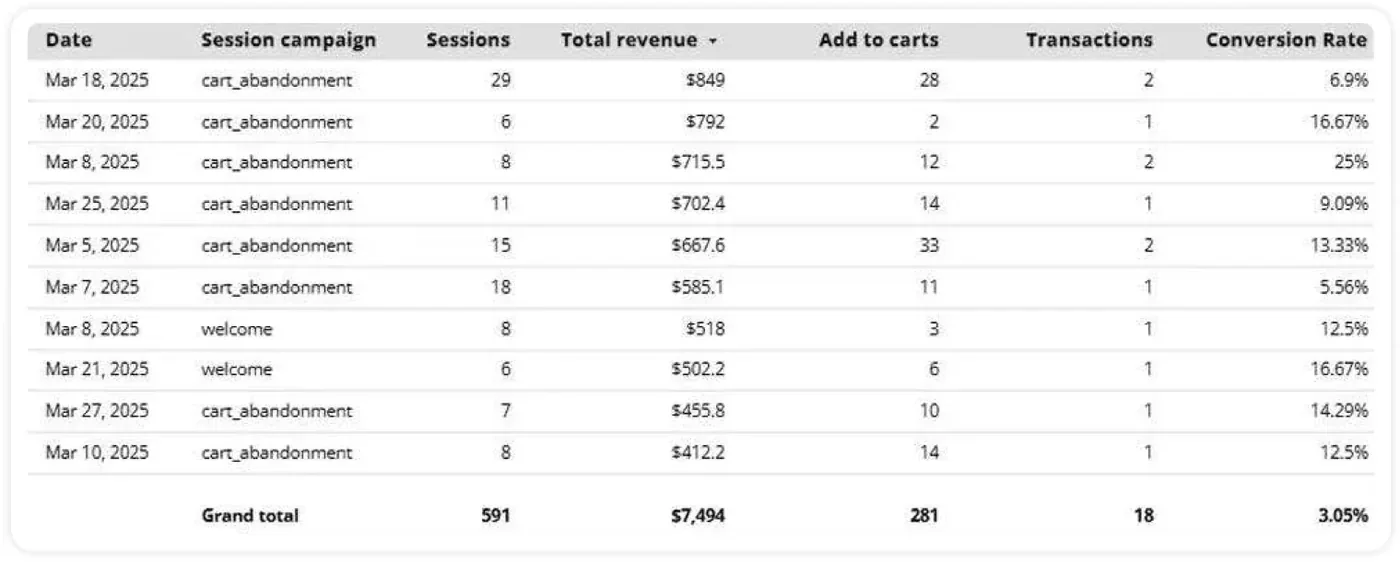
Brand B, which had a much smaller audience, still recovered more than $5K in a month with this feature and generated $7.5K overall.

Brand E Cosmetics
Brand E, another cosmetics company, drove over $15K in push revenue during a single month. In their case, the majority came from individual campaign sends rather than automation.

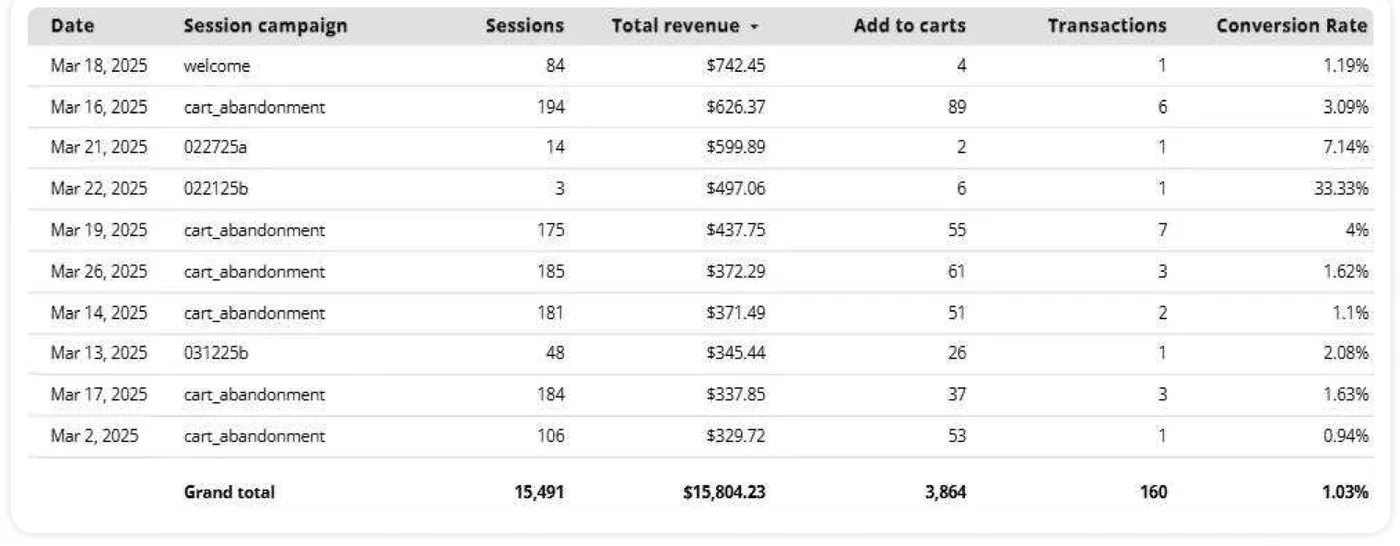
This shows that the channel can drive great results both on autopilot and when used proactively to promote new launches, events, and offers.
| Brand | Push revenue | Share from abandoned cart flow |
|---|---|---|
| Brand A (wellness) | $31,176.35 | $14,491.37 |
| Brand B (fashion) | $7,494.60 | $5,765.60 |
| Brand E (cosmetics) | $15,804.23 | $4,725.78 |
These notifications are instant, visual, and do not require breaking through the inbox.
They are also free to send, which makes the revenue they generate even more valuable.
Does abandoned cart push really make that big of a difference?
If you do nothing else, turn on automated cart reminders.
Every brand that enabled this flow recovered significant revenue. And in every case, it ran quietly in the background. There was no discounting, no ad spend, and no extra effort beyond initial setup.
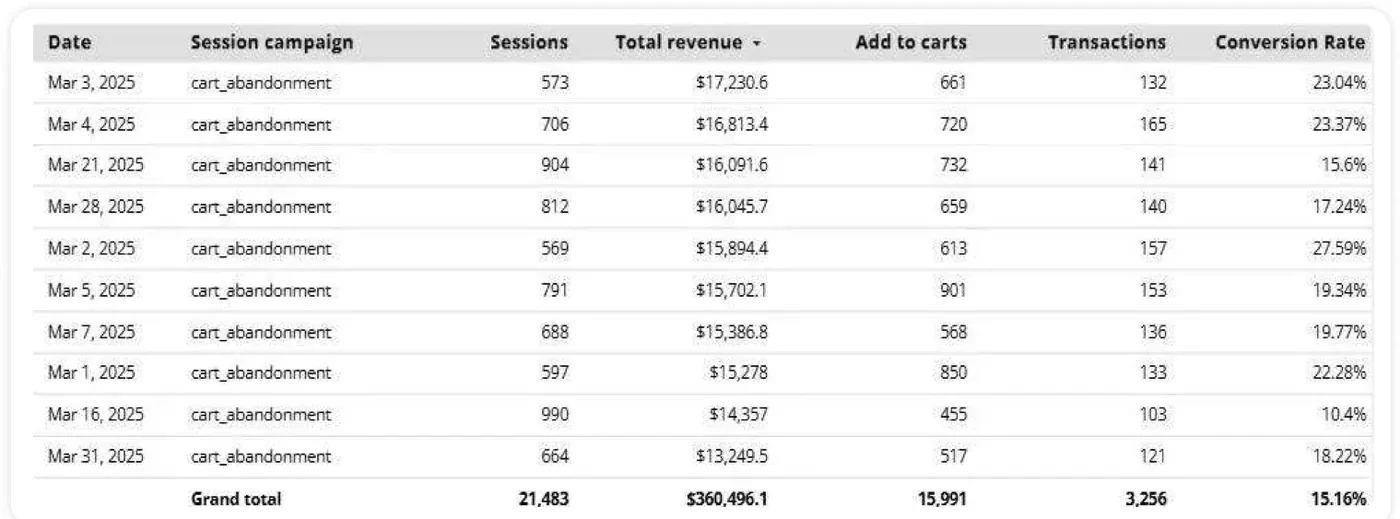
Brand D Cannabis retailer
This brand recovered over $360K in a single month through abandoned cart push alone.

Brand A Wellness
Brand A, with a much smaller audience, still recovered more than $14K.
Brand B Luxury fashion
Even Brand B, which had only launched recently, recovered more than 75% of its total push revenue through this one automation alone.
| Brand | Revenue recovered |
|---|---|
| Brand D (cannabis) | $360,496.10 |
| Brand A (wellness) | $14,491.37 |
| Brand B (fashion) | $5,765.60 |
These results came from a smaller list of push users, but that’s the point. These are the customers most likely to purchase, and push helps close the loop.
How does push compare to SMS and email?
Push notifications aren’t just cheaper and faster to deploy, they also punch well above their weight. We looked at two of these brands where performance data was available across push, email and SMS.
Brand B Luxury fashion
Even with a smaller list size, push delivered stronger engagement and higher revenue per user for Brand B. In this case, push drove nearly 10x more revenue per user than SMS and over 19x more than email.

Brand A Wellness
An interesting case where they don’t have a robust email program in place currently, but instead use push as their primary reengagement channel. While email has a surprisingly high add-to-cart rate, push still converted 2x better with a 2x higher ARPU.

But they consistently prove to be the most efficient and highest-performing of the three, especially when used to target your most engaged users.
Does app performance improve over time?
Yes. In fact, we saw the strongest results come after launch, once brands started layering in campaigns and automations.
Campaign sends added to the automation lift, and both worked in tandem to drive more repeat visits and more orders.
That improvement did not come from increased traffic. It came from better usage of a tool the brand already had.
What if we don’t have a huge app user base?
Brand B had a relatively small app audience compared to others in this group, but their app still contributed over 20% of total revenue, 35% of mobile revenue, and converted 10x better than mobile web.
An app does not need massive scale to work. It just needs usage.
Their push list was also fairly small, but it still recovered thousands in revenue through automation.
How much does it cost to maintain an app? Is it worth it?
There’s no extra design or development needed, and once it’s live, you only have to maintain your existing site while our team takes care of everything app related.
To put this into perspective, here’s roughly what each of these brands spent to achieve these results along with their Q1 ROI:
| Brand | App revenue contribution | Monthly app cost | Q1 app cost | Push notifications | Q1 ROI |
|---|---|---|---|---|---|
| Brand A (wellness) | $2.07M | $1,500 | $4,500 | $0 | 459x |
| Brand B (fashion) | $194K | $600 | $1,800 | $0 | 108x |
| Brand C (cosmetics) | $1.82M | $2,000 | $6,000 | $0 | 303x |
In general, it’s not uncommon for brands who add an app to their retention strategy to see these outsized returns.
So, do apps really work?
The app consistently outperformed web on engagement, conversion, and revenue contribution. Push notifications drove results with almost no cost or complexity. And brands that activated their apps fully saw continued growth as they layered in more functionality over time.
If you want a channel that improves your repeat purchase rate, builds stronger customer habits, and helps you recover sales automatically, the app is a smart investment.
Especially if you already have loyal customers who want a better way to shop.
Industry outlook
Let’s zoom out and look at the entire landscape of mobile commerce, specifically mobile apps, and how consumers prefer to shop today.
Mobile app adoption trends
Mobile app usage for shopping has become mainstream, with over three-quarters of US smartphone users regularly engaging with retail apps.
Adoption is particularly strong among younger demographics and higher-income households, with millennials leading usage rates. The integration of apps with in-store shopping experiences demonstrates the evolution toward truly omnichannel retail experiences.
App usage & mobile shopping
- 76.5% of US smartphone users (163.8 million people) use shopping apps
- 78% of consumers worldwide use mobile apps for shopping
- Higher-income households have an 82% adoption rate for shopping apps
- 64% of US consumers (and 53% of UK shoppers) say they’re more likely to use a brand’s mobile app than shop on their mobile website
- 21% of consumers say they do most of their online shopping via apps
Vertical variations
- Apparel and beauty are the top mobile app categories in the US
- Big-ticket categories (e.g., appliances, auto) are less likely to be purchased in-app but there’s still an app audience here as well
- Fast-fashion and general merchandise retailers dominate download charts
Demographics
- 61% of millennials have downloaded retail apps, and 58% prefer purchasing via apps
- In the US, adults aged 25-34 account for ~32% of ecommerce mobile app users, the largest share of any age group
In-store app integration
- Around 4 in 10 U.S. shoppers use a mobile device during in-store trips – primarily for price comparisons (47% of in-store app users), checking discounts (40%), and accessing coupons (35%)
- Worldwide, 74% of consumers use retail apps while shopping in physical stores
- Users opt in to push notifications primarily for exclusive discounts, loyalty rewards, and personalized offers
App adoption among brands
App adoption rates, while an interesting metric to look at will always be skewed considering the low percentage of total brands that fall into the highest revenue brackets.
Here’s an overview of app adoption rates as of 2024:
- 21.5% of US brands with $5M+/mo in revenue
- 4.56% of US brands with $100K+/mo in revenue
As for Shopify specifically, here’s how app adoption rates look:
- 3.37% of US brands with $50k+/mo in revenue
- 4.24% of US brands with $100k+/mo in revenue
One standout observation is that ecommerce brands with custom-built websites are 2x more likely to have a mobile app.
Ecommerce app engagement metrics
Mobile apps drive higher user engagement than mobile (and, often, desktop) websites.
Customers spend substantially more time, interact more frequently, view more products, and engage in deeper browsing behaviors when using a brand’s app.
The dramatic difference in time spent and interaction depth shows the superior engagement potential of apps.
Time spent in apps
- Users spend 201.8 minutes per month on average shopping in apps vs 10.9 minutes on mobile websites
- App users spend 64% more time in-app per visit than mobile web visitors
- Global consumers spend over 41.9 billion hours using shopping apps
- US shoppers spend over 3.3 billion hours in shopping apps – a number that’s rising double-digit percentage points each year
Usage frequency
- 56% of global consumers shop on mobile at least once a week
- Brands report app customers shop 1.7-2x more often per month than mobile web users
- Mobile app users: 2.70 sessions per month
- Mobile website users: 1.40 sessions per month
- Desktop users: 1.36 sessions per month
| Mobile app users | 2.70 |
|---|---|
| Mobile web users | 1.40 |
| Desktop users | 1.36 |
Browsing behavior
- Users view ~4.2x more products per session in retail apps compared to mobile sites
- Shopping apps see a median ~1.45 sessions on the first day of install
- Marketplace/classified apps tend to draw higher usage, starting at 1.84 sessions on day 1
- The average shopping app session lasts ~7.25x the length of a mobile web session
- Mobile app: 9.15 minutes average session time
- Desktop: 2.34 minutes average session time
- Mobile website: 1.26 minutes average session time
| Mobile app | 9.15 |
|---|---|
| Mobile web | 1.26 |
| Desktop | 2.34 |
The conversion impact of apps
Mobile apps consistently outperform both mobile websites and desktop in conversion metrics.
Apps have higher conversion rates, increased average order values and lower cart abandonment (as well as enhanced ability to recover abandoned carts).
These metrics translate directly into measurable improvements in bottom-line revenue and profit for brands with mobile apps.
App vs web vs desktop conversion rate
- Shopping apps convert ~1.7x higher on average than mobile websites
- Ecommerce apps’ conversion rates average ~3.5%, compared to roughly 2.0% on the mobile web
- Apps even outperform desktop sites – studies show apps have about 1.5x more conversions per session than desktop on average
- DTC mobile apps we looked at drive anywhere from 1.3x to 7x higher conversion rates than their mobile web counterpart
- On average, Shopify mobile apps have a conversion rate of 6.14% – a significant increase compared to mobile sites (1.57%) and desktop (3.06%)
| Mobile app | 6.14% |
|---|---|
| Mobile web | 1.57% |
| Desktop | 3.06% |
Average order value
- DTC mobile apps we studied returned anywhere 10-50% higher AOVs than their mobile websites
- The majority of apps averaged 10-20% higher AOVs, while high-performers had AOVs 50% or higher than their website
- Industry reports show app users spend about $95 per order vs ~$73 on websites
- Categories like fashion and electronics drive particularly higher AOV on app purchases
| Mobile app | $95 |
|---|---|
| Website | $73 |
Cart abandonment rates
- One-click checkout can boost conversion rates by up to 60%
- Mobile apps have a 23% higher purchase rate, 85% higher add to cart rate
- Abandoned cart notifications get as high as 22% conversion rates
- We found DTC brands recovered 17% more abandoned carts with an app compared to using email or SMS only
| Purchase rate | +23% |
|---|---|
| Add to cart rate | +85% |
| Cart recovery rate | +17% |
Revenue & ROI from mobile apps
Mobile apps generate disproportionately high revenue relative to their user base, with some retailers seeing apps contribute up to 60% of their total online sales.
While traditional mobile app development requires significant investment, modern solutions, like MobiLoud offer faster time-to-market and quicker ROI.
The higher conversion rates, increased average order values, and enhanced customer retention make apps a winning investment for ecommerce businesses.
The revenue contribution of apps
- Studies find mobile apps account for 20% (on the low end) to 78% (upper estimate) of mobile commerce sales – roughly 2x the revenue of mobile websites
- DTC brands we looked at report anywhere from 10-60% of their online revenue coming through mobile apps, with the average around 20-30%
- Brands with successful apps and high repeat purchase rates/mobile usage can drive 40–60% of total online sales through their app
- App users bring in ~$4.30 in revenue per user versus only ~$1.22 via mobile websites (3.5x higher ARPU)
- Top 1000 North American retailers with shopping apps saw +7.4% year-over-year online sales growth, vs. only +4.2% for retailers without an app
| Mobile app users | $4.30 |
|---|---|
| Mobile website users | $1.22 |
ROI timeline
- Traditional mobile apps cost anywhere from $100,000 - $250,000 to build, with timeline to launch as much as 10-13 months
- Many companies building custom apps report ~6-18 months to break even
- With managed web to app solutions like MobiLoud, you can go live for a one-time setup fee
- Through abandoned cart notifications, you can generate $10k+ in revenue, driving 5-10x ROI in just one month through one push campaign alone
| Web to app conversion (MobiLoud) | $18,000+ |
|---|---|
| Custom development | $150,000+ |
| Web to app conversion (MobiLoud) | 2 |
|---|---|
| Custom development | 18 |
Costs – implementation & maintenance
- Custom native app development typically costs $100,000+ for iOS and Android
- Maintenance, updates, and operations add roughly 15-20% of the development cost per year
- MobiLoud starts from $1,499 per month – covering all maintenance, support, infrastructure for about $15-18k per year
ROI calculation factors
- Key drivers of positive ROI include improved conversion, higher AOV and frequency, and increased retention/LTV
- If a brand invests $18k yearly in a mobile app, at 10% profit margins, they would only need to drive $15k in new revenue per month to break even (brands we studied generated $10k-200k per month in abandoned cart revenue alone)
- App users typically buy at higher profit margins – due to lower CAC (typically zero marketing spend for repeat purchases), further increasing real ROI from mobile apps
- MobiLoud users have seen as much as 57x ROIs from their mobile apps
The impact on retention and lifetime value
App users demonstrate significantly higher retention rates, repeat purchase frequency, and lifetime value compared to web-only shoppers.
The higher engagement of mobile apps translates into stronger, more profitable long-term customer relationships, with app users showing 2.8-5x higher lifetime value than web-only customers.
Retention rates & repeat purchase frequency
- Mobile apps increase customer retention by 5x versus mobile websites
- 60% of first-time app buyers will make at least one more purchase in the app
- 60% of app customers make multiple purchases in a year, compared to only 40% of mobile website customers
- App users tend to purchase ~33% more often than non-app users
- The overwhelming majority of retailers and brands self-report that app customers make more repeat purchases and are more loyal than non-app customers
The uplift in lifetime value (LTV)
- App customer LTV is about 2.8x-5x higher than that of customers who only shop via web channels
- Google studies found app users are more loyal and willing to share twice as much first-party data
- DTC brands we studied drive an average of 4-7x higher LTV from app users
Push notifications
Push notifications are one of the biggest advantages an app has over the mobile web. They land straight on the lock screen, cost nothing per message, and keep driving revenue on autopilot once your automated flows are set up.
Next to email, push gets twice the visibility and 3-5x the click-through rate, and our data shows it drives higher order values than email or SMS.
Engagement rates & revenue impact vs email & SMS
- Push averages 2x the visibility rates of email
- Push notifications average around 3-5% CTR; 3-5x that of email, and comparable to SMS (at much lower cost)
- Push notifications average 1.5-4% conversion rates
- Our data shows an average of 1.2-1.4x higher AOV from push notifications compared to email and SMS
- Our users typically see 2-2.5x average revenue per push subscriber compared to email and SMS, with high performers getting over 10x the ARPU from push notifications
- Most of our customers generate thousands in monthly revenue from automated push notifications (evergreen campaigns that are set up once, to run forever)
Conversion rates by notification type
- Contextual push messages (welcome messages, abandoned carts) see ~16.3% open rates, versus only 4.7% for untargeted generic pushes
- In one analysis, promotional push notifications led to 9.6x more users making a purchase compared to a control group
- Push marketing increases in-app spending by 16% on average
Optimal frequency benchmarks
- Fashion and beauty retailers tend to send ~2-5 push notifications per week
- Electronics retailers send about 1-2 push notifications per week
- Furniture/home goods send around 1 push notification per week
- Heavily promotional models might go up to 3-7 pushes/week
Optimal timing benchmarks
- Weekends and late afternoons yield the best results for push notifications
- Push notifications sent on Saturday result in ~2.2x more purchases than those sent on Thursdays
- Messages in the late afternoon achieve ~2.7x more purchases than those sent earlier in the day
- Monday-Wednesday also see relatively high open rates for retail apps
Revenue attribution & push ROI
- Automated push messages comprise just 3% of push sends but drive 21% of all push-attributed orders
- Cart recovery pushes have high open rates (in some cases ~58% open for automated pushes vs 34% for campaign pushes)
- Three MobiLoud brands brought in between $10,000 to $200,000 revenue in 30 days via abandoned cart notifications alone
- Push notifications typically cost around $100-200 per month for a push service, with no incremental cost per message
App promotion & growth strategies
The effectiveness of a brand’s app is clearly tied to their ability to acquire app users. With app users shopping more often, staying engaged for longer, and converting at a higher rate and spending more in each session, the more website visitors the brand can convert into app users, the higher the ROI.
The good news – ecommerce apps have a much lower cost per acquisition than mobile apps in other sectors, as these tend to already be engaged customers, on your email list and visiting your website.
Cost per download benchmarks
- The average cost per install (CPI) in Western markets is about $4.50 on iOS and $3.20 on Android
- Some sources put the CPI closer to $2.50
Website conversion tactics
- Most retailers use smart banners or pop-ups on their mobile sites to encourage app downloads
- Many offer app-exclusive discounts as an incentive to download, typically starting at 10% off (on the first order through the app)
- On Apple’s App Store, about 33.7% of product page views convert to an install
- On Google Play, about 26.4% of product page views convert to an install
Mobile commerce trends & predictions
Mobile commerce (and the way mobile apps fit in to the greater ecommerce landscape) will continue to evolve. Brands are continuously dealing with changing privacy regulations which force them to look for new ways to engage customers.
Apple’s tracking limitations and the move away from third-party cookies have pushed brands to focus on gathering their own customer data directly through their apps.
This means more transparent opt-in processes and giving customers clearer control over their information. Smart brands are creating preference centers in their apps, letting shoppers decide exactly what data they’re willing to share in exchange for personalized experiences.
AR features are becoming more popular and widely available, with virtual try-on tools offering a practical way for fashion brands in particular to increase conversions and reduce returns.
In a broader sense, technology – particularly, AI – is making shopping smarter and more personal. It’s become easier for brands to sift through customer information to provide hyper-relevant experiences and far greater convenience for customers.
Social media and shopping are increasingly blending together, with apps like Temu and Shein finding success blurring the lines between a traditional shopping experience and a TikTok-style feed of constant dopamine hits. Mobile loyalty programs are moving beyond simple points to offer unique experiences and game-like engagement.
Finally, new flexible tech approaches are helping brands quickly add features without rebuilding everything, making it easier to keep up with what consumers want.
Ultimately, the trends also show that mobile is here to stay – and, in fact, likely to keep growing.
Younger consumers are more likely to be mobile-first, and with mobile user experiences consistently getting better, the blockers to making sales on mobile are falling away.
Mobile apps are just another way mobile shopping offers a more convenient experience for the customer.
And the good news, if you’re running an ecommerce business, is that many other brands are still not on board with the benefits of mobile apps. If you launch your app now, you’ll still be ahead of many other brands in your category.
The sizeable impact of mobile shopping apps
The data we’ve presented throughout this report shows that mobile apps are one of the highest-performing channels for most brands that launch one.
Apps consistently outperform both mobile web and desktop experiences across every meaningful metric, from engagement and conversion to repeat purchases and customer lifetime value.
With app users generating up to 7x more revenue per user, contributing 40-50% of online sales for leading brands, and driving 5x higher retention rates, the business case for investing in mobile apps is compelling.
What’s most compelling is that it doesn’t take a huge investment and a drawn-out process to build a mobile app. If your brand’s mobile website performs well, you can simply convert what you already built for the web into an app, and launch in 2 to 4 weeks, for an investment that makes it quick and easy to achieve a positive ROI.
That’s what MobiLoud has been helping brands do for over a decade.
We’re not just a tool, we’re a service – giving your brand a dedicated team of experts to not only build and launch a mobile app, but to ensure that it drives meaningful results for your brand.
Just check out the links below to learn more about MobiLoud, or to get in touch, and you can soon be adding 5-6 figures in new monthly revenue for minimal effort, with little to no overhead.
Check out the links below to learn more about MobiLoud.
Want to see exactly how your app will look and feel?
We’ll build you a live, interactive preview with no commitment required.
It’s the fastest way to experience how your brand can stand out, drive more repeat sales, and stop getting lost in email inboxes.
Get a free preview of your appYour website is already doing the hard work. With MobiLoud, you can turn it into a high converting mobile app in 2 to 4 weeks.
No rebuilding, no code, no extra tech headaches. Just a powerful new channel for your most loyal customers.
See what we doThank you for reading!
We’re so glad you took the time to read our report on ecommerce mobile apps.
We put this together because we’re seeing a massive shift in how brands connect with their best customers – and mobile apps are at the center of it all.
With acquisition costs climbing and mobile web performance declining, apps are emerging as a powerful way to drive deeper connections and more repeat purchases.
At MobiLoud, we’re all about helping brands like yours turn loyal customers into repeat buyers through smarter, more seamless mobile experiences.
If you’d like to learn more about how an app could fit into your retention strategy we’d love to chat!
Thanks again for reading. We hope you found it insightful.
— The MobiLoud Team
Data sources
This report was compiled from MobiLoud’s first-party data, as well as an aggregate of studies, research reports, surveys and case studies from around the web.
Sources used include: